 Back

An analysis of NACUBO endowment data, fiscal years 2018–2025
Key findings
Endowments funded an average of 15.2% of participating institutions' operating budgets in fiscal 2025, up from 10.3% in fiscal 2018. The median was 6.1%, up from 4.0%.
Institutions withdrew $33.4 billion from their endowments in fiscal 2025, about 55% more than the $21.6 billion reported for fiscal 2018.
The average effective spending rate rose from 4.4% to 4.9% over the same period.
In fiscal 2025, endowments over $5 billion had 62.5% of assets in private and alternative strategies. Endowments under $50 million had 12.5%.
More than half of institutions with endowments under $500 million used an outsourced chief investment officer (OCIO) in fiscal 2025.
In fiscal 2018, endowments funded an average of 10.3% of college and university operating budgets. By fiscal 2025, that figure had climbed to 15.2%, according to the latest NACUBO-Commonfund Study of Endowments. In seven years, the average share of operating budgets funded by endowments rose by nearly half.
When an institution depends more heavily on its portfolio to pay for its mission, investment decisions affect more than investment results. Committees still have to pursue good long-term returns. They also have to build and oversee a portfolio that can keep funding the institution when markets are weak.
NACUBO studies higher education, but the challenge extends well beyond colleges and universities. Independent schools, community foundations, supporting organizations, healthcare institutions and other nonprofits face the same basic problem: using investment assets to support today's operations without compromising the resources needed tomorrow.
Endowments Are Carrying More of the Operating Budget
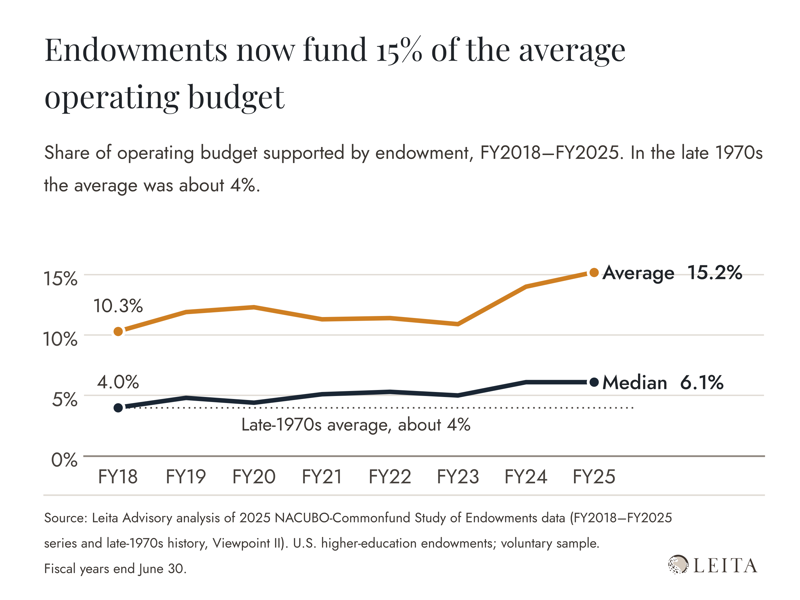
Fiscal Year | 2018 | 2019 | 2020 | 2021 | 2022 | 2023 | 2024 | 2025 |
Average share of operating budget funded by endowment | 10.3% | 11.9% | 12.3% | 11.3% | 11.4% | 10.9% | 14.0% | 15.2% |
Median | 4.0% | 4.8% | 4.4% | 5.1% | 5.3% | 5.0% | 6.1% | 6.1% |
At some institutions, the endowment pays for additional programs and strategic initiatives. At others, annual distributions keep current operations running. Two institutions can hold portfolios of similar size, with similar long-term return targets, and still need very different things from them.
The NACUBO data illustrates this range. Although the average institution funded 15.2% of its fiscal 2025 operating budget from endowment distributions, the median was just 6.1%. Some institutions are much more dependent on their endowments than others.
Reliance is no longer just a large-endowment story. Institutions with $1 billion to $5 billion relied on their endowments for 20.1% of their operating budgets in fiscal 2025. Institutions with less than $100 million relied on them for 14.8%, more than double the 6.9% reported by the smallest institutions in fiscal 2018. (NACUBO redefined its size groups in fiscal 2023, so the two smallest-size figures are not an exact match.)
A university that relies on its endowment for a large share of annual expenses may not be able to cut distributions after a market drop. The same is true of an independent school funding financial aid, or a healthcare foundation whose distributions support ongoing programs. Student financial aid alone received 47.4% of endowment distributions in fiscal 2025. Their committees have two questions to answer: how much risk the portfolio can tolerate over a long horizon, and how much the institution can tolerate along the way.
Portfolio Complexity and Institutional Needs
Investment approaches vary widely by endowment size. In fiscal 2025, institutions with less than $50 million allocated an average of 12.5% to private and alternative strategies (private equity, venture capital, marketable alternatives such as hedge funds, and real assets). Institutions with $251 million to $500 million allocated 32.3%, and those above $5 billion allocated 62.5%.
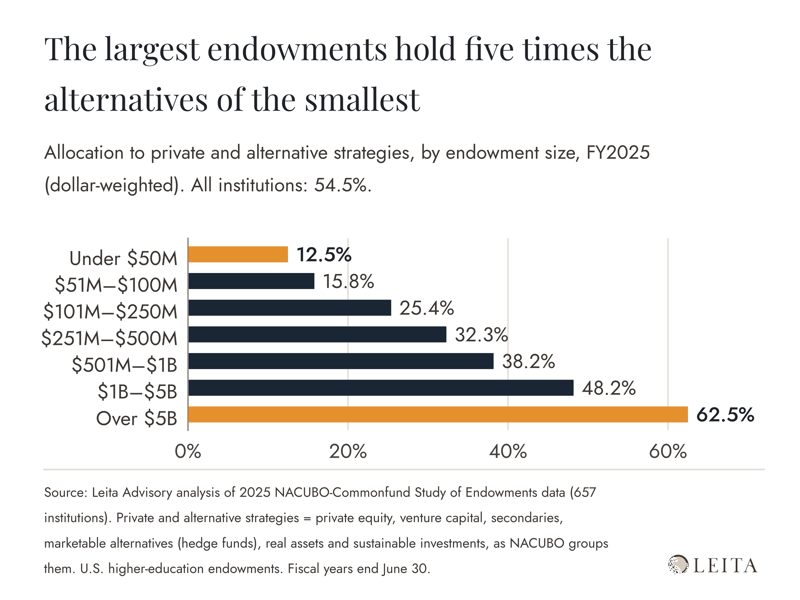
Endowment size | Under $50M | $51M-$100M | $101M–$250M | $251M–$500M | $501M–$1B | $1B–$5B | Over $5B | All |
Private and alternative | 12.5% | 15.8% | 25.4% | 32.3% | 38.2% | 48.2% | 62.5% | 54.5% |
The gap is wide, but the return gap is much narrower. Over the 10 years ended June 30, 2025, endowments over $5 billion earned 8.9% a year. Every other size group earned between 7.4% and 8.0%, including the smallest at 7.5%, despite holding very different amounts in alternatives. The largest endowments also have investment staff, scale and access to managers that most institutions don't. The data doesn't show that more complexity is the right answer for every institution.
A portfolio of publicly traded investments can provide diversification, transparency, liquidity and low implementation costs. Passive equity strategies have also done well in recent years. The S&P 500 returned 26.29% in 2023, 25.02% in 2024 and 17.88% in 2025, including reinvested dividends.
Those returns come with volatility. The same index lost 18.11% in 2022. An institution that has to keep funding operations through a decline that size can face both financial and governance problems. Selling assets to make distributions during a downturn can also leave less capital available to participate in a recovery.
Alternative strategies, including private investments, can add diversification and different sources of return. They also bring higher fees, less liquidity, more difficult valuations and additional oversight work. For an institution with significant annual spending needs, the liquidity available from its investments can be just as important as their expected returns.
Large endowments often have internal investment teams and operations staff to oversee these portfolios. Smaller institutions usually rely on outside partners for much of that work. In fiscal 2025, more than half of institutions with endowments under $500 million used an outsourced chief investment officer (OCIO), peaking at 61.3% between $101 million and $250 million. No participant with more than $5 billion reported using one. Either way, the committee should ask whether the portfolio's complexity serves the institution's objectives, and whether the organization has the staff and governance structure to manage it.
Rising Withdrawals and Spending Rates
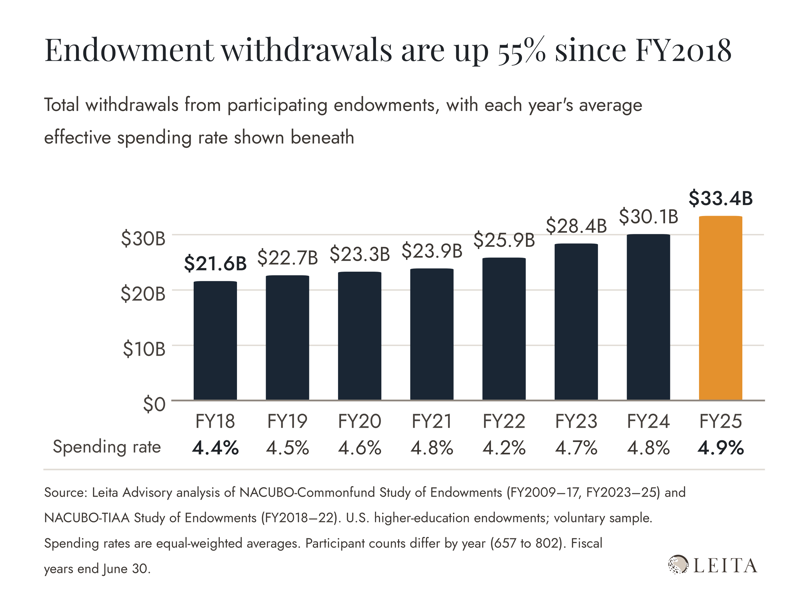
Fiscal Year | 2018 | 2019 | 2020 | 2021 | 2022 | 2023 | 2024 | 2025 |
Total withdrawals | $21.6B | $22.7B | $23.3B | $23.9B | $25.9B | $28.4B | $30.1B | $33.4B |
Average effective spending rate | 4.4% | 4.5% | 4.6% | 4.8% | 4.2% | 4.7% | 4.8% | 4.9% |
Endowment withdrawals have grown, both in dollars and as a percentage of assets. Institutions participating in the NACUBO studies reported $21.6 billion in withdrawals in fiscal 2018 and $33.4 billion in fiscal 2025, an increase of approximately 55%. Over the same period, the average annual effective spending rate rose from 4.4% to 4.9%.
These figures measure different things. Total withdrawals represent the dollars institutions distribute from their endowments, while effective spending rates measure distributions relative to endowment assets. The NACUBO studies also include different groups of institutions from year to year (802 in fiscal 2018, 657 in fiscal 2025), so the aggregate figures do not represent a fixed set of portfolios.
The increase in spending rates is particularly important. Institutions are distributing a somewhat larger share of their endowment assets, even as those distributions account for a growing portion of operating budgets. The change doesn't necessarily indicate that institutions are spending too much, but it does raise questions about the long-term balance between current spending and preserving purchasing power.
For colleges and universities, those distributions fund scholarships, academic programs, faculty positions, facilities and other core activities. Independent schools, healthcare institutions and other nonprofits use investment distributions to support their own ongoing operations.
Spending policy and investment strategy are closely connected. Whether a long-term return target is reasonable depends on the institution's spending requirements, liquidity needs, inflation exposure and ability to get through years of weak returns. In fiscal 2025, institutions that set a nominal return target aimed, on average, for 7.3%; those that set a target above inflation aimed for inflation plus 4.9%. The average trailing 10-year return was 7.7%.
A portfolio can do well over a decade and still cause serious trouble if poor returns arrive when operating pressure is high. An allocation that looks efficient on paper can be a poor fit for an institution that needs reliable access to cash.
Committees also need to consider how spending and investment decisions affect each other over time. Increasing distributions may help meet immediate operating needs, but leaves less capital invested for future growth. Reducing distributions may help preserve the portfolio, but can mean difficult choices about programs, staffing or other expenses. Neither decision can be made without considering the institution's broader financial circumstances.
These are governance questions for the whole institution, and committees should treat them that way.
Know What the Endowment Is Being Asked to Carry
Investment committees have always balanced return objectives, risk and the long-term preservation of assets. The NACUBO data shows how much more dependent many higher education institutions have become on the portfolios they oversee.
That finding should prompt similar questions at any institution where investment assets support ongoing operations. How much of the annual budget depends on portfolio distributions? How would a sustained market decline affect those distributions? Does the portfolio have enough liquidity to meet spending needs without forcing investment decisions at the wrong time?
Committees need a clear picture of what the portfolio is expected to do. That means understanding the institution's spending needs, the portfolio's liquidity, how it would hold up in different markets, and what it takes to oversee the chosen strategy.
The right portfolio fits the institution's objectives, constraints and capacity for oversight. That will differ from one organization to the next. More complexity doesn't by itself mean better investment management.
Ultimately, an institution's endowment has to serve two purposes: supporting the mission today and preserving the resources to support it tomorrow. As institutions ask more of their portfolios, investment committees need to make sure their strategies can meet both obligations.
---
Sources and Methodology
NACUBO endowment data
2025 NACUBO-Commonfund Study of Endowments (February 2026): fiscal 2018–2025 operating-budget support, by size and in total; fiscal 2025 withdrawals, spending rate, asset allocation by size (Figure 3.1-s), OCIO use by size, return targets, 10-year returns and spending by purpose. Press release
2018 NACUBO-TIAA Study of Endowments (January 2019): fiscal 2018 withdrawals of $21.6 billion. Results
2022 NACUBO-TIAA Study of Endowments public tables: average effective spending rates, fiscal 2013–2022.
Withdrawals for fiscal 2019–2024 are from the NACUBO-TIAA and NACUBO-Commonfund studies for each year.
NACUBO Endowment Research
Public equity returns: S&P 500 calendar-year total returns, including reinvested dividends, 2022–2025 (S&P Dow Jones Indices). These returns are not directly comparable to endowment fiscal-year results.
Methodology: NACUBO data reflect participating institutions, and the survey population changes from year to year. Comparisons of average operating budget support, spending rates and aggregate withdrawals should not be interpreted as changes experienced by a fixed group of institutions. "Private and alternative strategies" follows NACUBO's grouping: private equity, venture capital, secondaries, marketable alternatives, real assets and sustainable investments, dollar-weighted. Spending rates are equal-weighted averages. Findings about investment strategy and governance, including their application beyond higher education, are Leita Advisory's independent interpretation of the research.
About the Author
Anna Dunn Tabke, CFA, CAIA, is the founder and president of Leita Advisory, an independent institutional investment governance and OCIO search consulting firm. She has personally led more than 100 institutional OCIO searches.



 anna@leitaociosearch.com
 678-322-7182
 Leita Advisory on LinkedIn